Driftscape's analytics feature empowers Organization Managers to monitor and assess user engagement with their content. By understanding how users interact with your content, you can optimize your offerings to better meet audience needs.
TABLE OF CONTENTS
- What are Driftscape Analytics?
- Examples of Use Cases for Driftscape Analytics
- Get Started: Accessing and Interpreting Your Analytics
What are Driftscape Analytics?
Driftscape Analytics is a tool designed to provide insights into user interactions within your organization's content on the Driftscape platform. It offers data on content views, user visits, and engagement metrics, enabling you to evaluate the performance of your POIs, tours, and other features.
Examples of Use Cases for Driftscape Analytics
Use Case 1: Evaluating Content Popularity
Analytics help determine which POIs, tours, and content elements receive the most views. If certain locations or stories are attracting significantly more engagement, you can use this insight to:
Create similar content that aligns with popular themes.
Highlight high-performing POIs in marketing materials.
Re-evaluate underperforming content to improve engagement.
Use Case 2: Understanding Visitor Demographics
By analyzing visitor home locations and distance traveled, organizations can:
Identify whether engagement is primarily local or from tourists.
Adjust promotional efforts based on where visitors are coming from.
Determine which geographical areas may benefit from targeted outreach.
For example, if a region primarily attracts visitors from a nearby city, local advertising might be more effective than broad national campaigns.
Use Case 3: Improving Regional and Tourism Strategies
Regional tourism boards, business improvement areas (BIAs), and municipalities can use analytics to:
Identify which areas receive the most foot traffic.
See how long visitors linger in specific locations.
Determine which attractions draw repeat visitors.
For instance, if analytics show that visitors frequently stop at a specific POI but don’t venture further into the surrounding area, businesses nearby might collaborate on promotions or signage to encourage further exploration.
Get Started: Accessing and Interpreting Your Analytics
Step 1: Access the Driftscape CMS
Log into the Driftscape CMS (cms.driftscape.com) and select the “Org Properties” button in the top menu.

Select the analytics button beside your organization.

Step 2: Adjusting Your Analytics
Once in the analytics dashboard, you can adjust which analytics you’re viewing using the main dashboard at the top of the page.

Adjustments include:
Time Frames: Select specific dates to view trends over days, weeks, or months. Or select a custom range using any dates. Which can be summarized by day, week, month or total.
Data Summarization: Change how data is grouped for better clarity.
Sub-layer Data: If your organization has sub-layers (e.g., different districts or event zones), data is combined into the parent organization’s analytics, but can also be viewed separately by accessing the analytics for an individual sub-layer under Org Properties.
Web Analytics Inclusion: Toggle whether to include engagement from Driftscape for Web users in your metrics.
Deleted POI Counts: Toggle whether you want to see data from content that's been deleted from the CMS
Once you have made your desired adjustments, you can view your analytics in the Driftscape CMS and export your reports to your computer. Click the “Download Analytics” button below the main dashboard to download.

All your reports will download as .CSV files, inside a .zip folder. Extract your .csv files from the .zip folder, then add the files to your preferred spreadsheet software to view (Google Sheets, Microsoft Excel etc.)
Step 3: Understanding your Analytics
You can view and analyze your analytics using the tables provided inside the CMS, or by exporting your data to a spreadsheet (.csv file). Either way, you will have the same information available to you:
Summary of All POI Views in the Period: This metric shows the total number of times users have viewed your POIs over the selected timeframe. The data is broken down by week or day, allowing you to identify trends in engagement. For example, you can see if views spike during holidays, special events, or campaigns. High view counts indicate strong user interest, while lower counts may point to content that could be refreshed or promoted more. Use this to understand your audience’s overall activity level with your content.
Views for the Most Popular 30 POIs: This chart highlights your top-performing POIs based on the number of views they’ve received. By comparing your most popular POIs, you can identify themes, types of content, or attractions that resonate strongly with visitors. This information can guide future content creation, ensuring new POIs align with proven audience interests. It also helps spotlight which attractions should be emphasized in marketing materials. Less-viewed POIs may need stronger promotion or updated storytelling to increase visibility.
Region Visits in the Period: Region Visits represent how many unique visitors were physically present in your region during the chosen timeframe. This helps you understand the size of your audience at a geographical level, regardless of whether they viewed content. Spikes in visits can often align with seasonal tourism or events, giving you a sense of what draws people to your area. Tracking visits over time helps measure growth and effectiveness of outreach campaigns. It’s a baseline metric for evaluating tourism activity.
Note: only users who have given Driftscape permission to access their location are counted.

Home Location of Region Visitors: This breakdown shows the postal code prefix or zip code where your visitors are coming from. By analyzing visitor origins, you can see whether your engagement is primarily local, regional, or from distant travellers. This data supports marketing decisions — for example, whether to focus on local community advertising or invest in outreach to farther regions. If most visitors come from nearby, partnerships with local businesses may be effective. On the other hand, seeing more distant origins may indicate success in attracting tourists.
Note: only users who have given Driftscape permission to access their location are counted.

Region Visitors Distances in the Period: This metric calculates how far visitors travelled to reach your region, based on their starting location. Shorter distances suggest more local traffic, while larger distances highlight your reach to visitors. Tracking these numbers over time can reveal whether your region is becoming more of a tourist destination or remains mainly locally driven. This insight can inform promotional strategies — for instance, tailoring messaging for “day-trippers” versus multi-day visitors. It also helps evaluate the success of regional or national advertising.
Note: only users who have given Driftscape permission to access their location are counted.

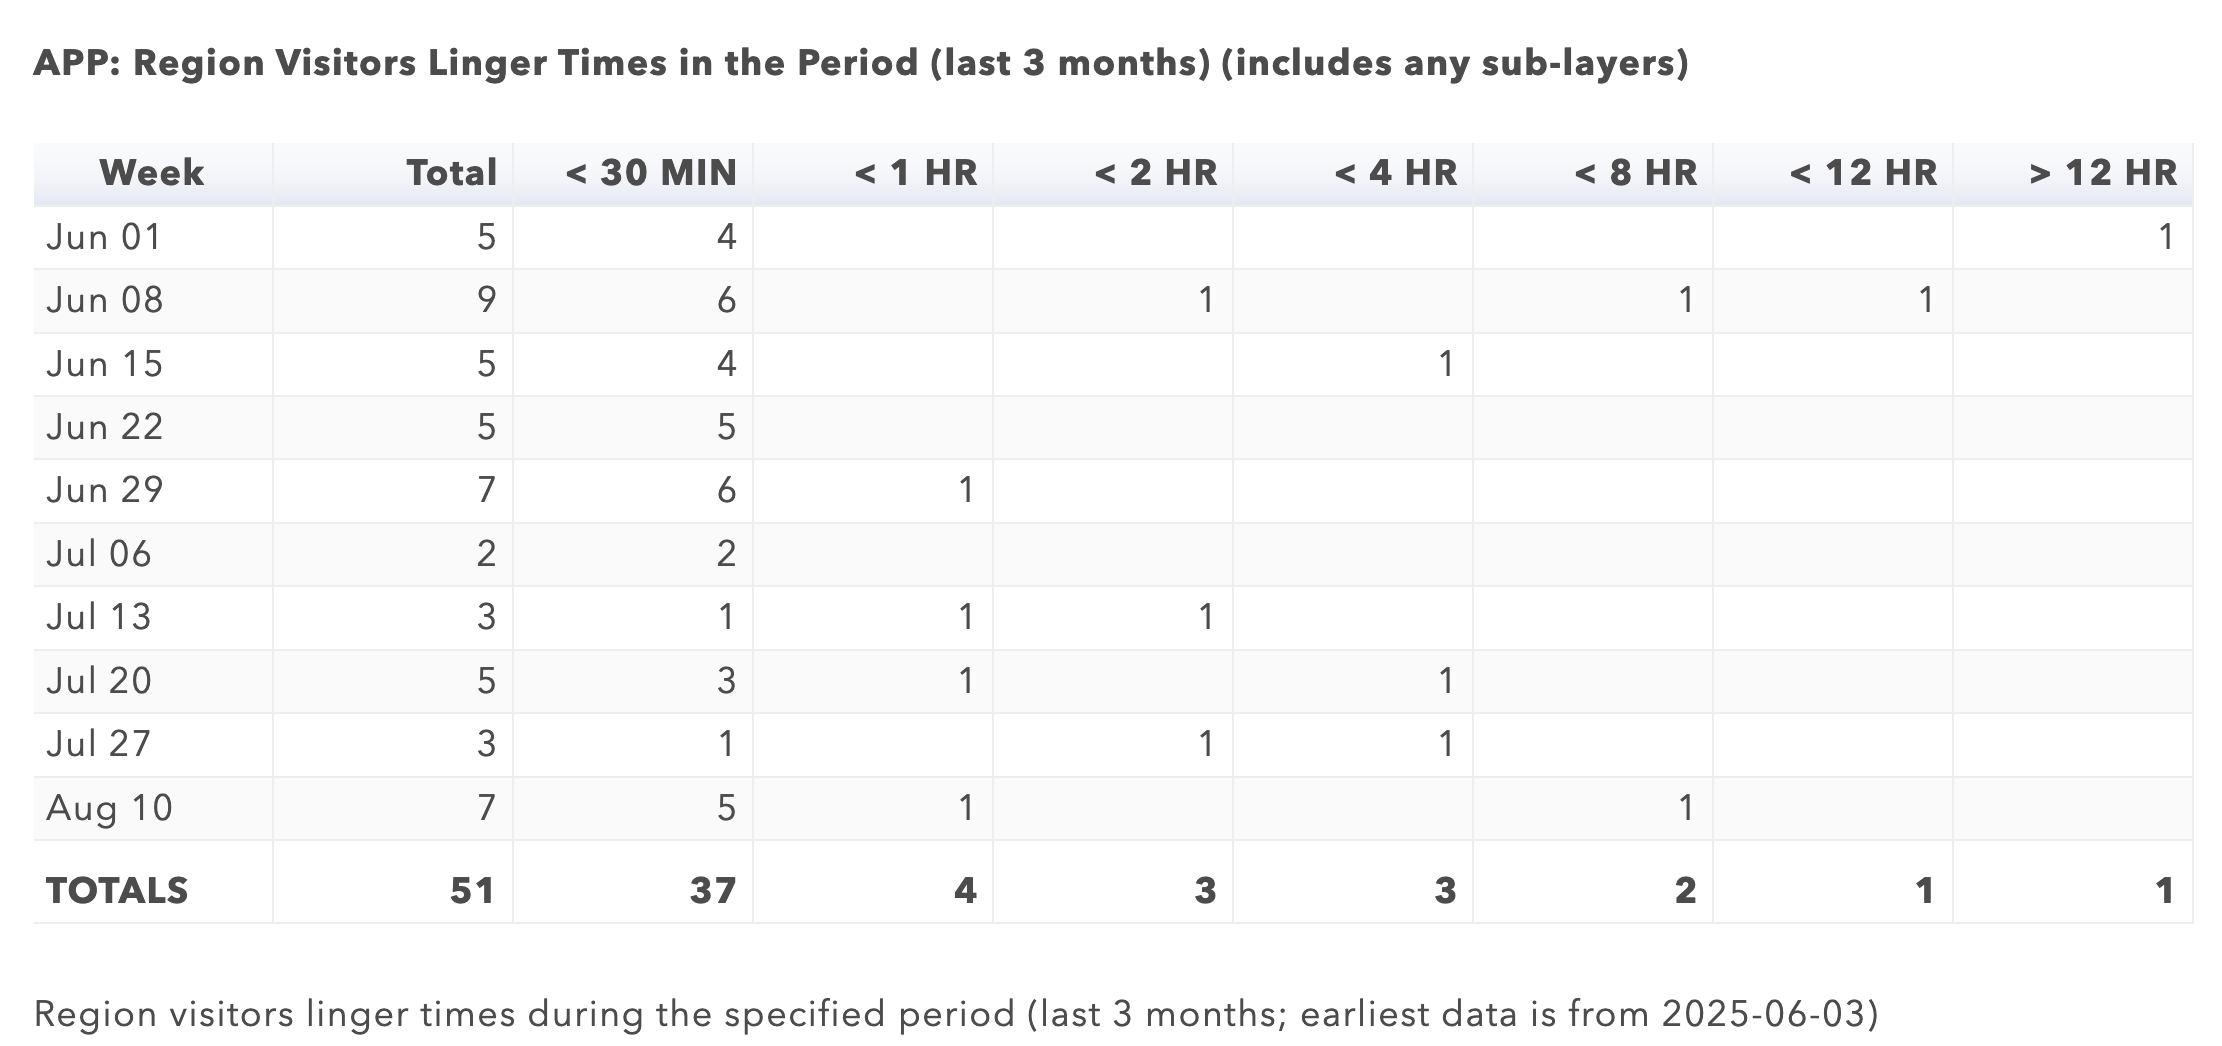
Region Visitors Linger Times in the Period: Linger Times measure how long visitors stay in your region once they arrive. Short stays may indicate quick visits to a single attraction, while longer stays show deeper engagement and exploration. Monitoring this helps determine whether your region is encouraging visitors to extend their time and potentially spend more money. If linger times are consistently short, it may point to opportunities for bundled experiences or improved signage that guides visitors to nearby attractions. Longer stays, meanwhile, suggest effective engagement strategies.
Note: only users who have given Driftscape permission to access their location are counted.
Partner Plan Compliance: The Partner Plan Compliance dashboard tracks your organization’s usage of Driftscape features compared to the limits included in your subscription. It covers metrics such as POIs, ABDs, tours, quests, and user seats, showing whether you are within plan allowances. Staying aware of this data helps prevent hitting limits unexpectedly and ensures you are making full use of your plan. For example, if you’re nearing your POI cap, you might plan to upgrade your subscription or reorganize content. Compliance status is also flagged clearly so you can quickly confirm whether your account remains in good standing.
Was this article helpful?
That’s Great!
Thank you for your feedback
Sorry! We couldn't be helpful
Thank you for your feedback
Feedback sent
We appreciate your effort and will try to fix the article